• Find a Home
    • Search by City or Neighborhood
    • South Bay RE News
    • Open Houses
      • Open Houses in El Segundo CA
      • Manhattan Beach Open Houses
      • Redondo Beach Open Houses
      • Torrance Open Houses
      • Hermosa Beach Open Houses
      • Palos Verdes Estates Open Houses
      • Rancho Palos Verdes Open Houses
      • Hawthorne CA Open Houses
    • All Manhattan Beach
      • Hill Section
      • Sand Section
      • Tree Section
      • Manhattan Village
      • East Manhattan Beach
      • East Manhattan – S of MB Blvd
      • Liberty Village
    • All Redondo Beach
      • North Redondo Beach
      • South Redondo Beach
      • The Village and Seascape
    • Hermosa Beach
    • El Segundo
    • Torrance
    • Palos Verdes
      • Palos Verdes Estates
      • Rancho Palos Verdes
      • Rolling Hills
      • Rolling Hills Estates
    • Hollywood Riviera
    • Hawthorne
      • Hollyglen and Del Aire
        • Three Sixty South Bay
        • Fusion South Bay Townhomes – Gated Community in Hawthorne
    • 55+ Senior Communities
    • Oceanfront Homes
    • Lawndale
    • Gardena
    • Marina Del Rey
    • Westchester
  • FREE Listing Updates
    • Entire South Bay
    • Manhattan Beach
    • Redondo Beach
    • Hawthorne, Hollyglen, 360 and Fusion
    • Torrance
    • Plaza Del Amo
  • Buyers
    • Search South Bay Homes
    • Search for homes
    • Buyer & Seller FAQs
      • Home Buyer and Seller Basics
      • Tips and FAQs
      • First Time Buyer Info
  • Sellers
    • Your Home’s Value
    • Recent South Bay Sales
    • Our Listing Presentation
    • What’s A CMA?
    • Listing and Selling
    • How We Market Homes
    • How We Sell Homes
    • Client Testimonials
  • Neighborhoods
    • Search by Neighborhood
    • Schools
      • El Segundo Schools
      • Hermosa Beach Schools
      • Redondo Beach Schools
      • Wiseburn School District
      • Torrance Schools – Information on the Torrnance USD
      • Manhattan Beach Schools
        • Manhattan School Boundary Map
        • Homes in Meadows area
        • Homes in Pennekamp area
        • Homes in Pacific area
        • Homes in Robinson area
        • Homes in Grandview area
      • Palos Verdes School District
      • Hawthorne Elementary School District
      • Lawndale School District
        • Lawndale School Boundary Map
    • El Segundo
    • Hawthorne
    • Hermosa Beach
    • Lawndale
    • Manhattan Beach
      • Sand Section
      • Manhattan Village
      • Tree Section
      • Hill Section
      • East Manhattan
    • Palos Verdes
      • Real Estate Map
    • Redondo Beach
      • North Redondo Beach
        • The Golden Hills
      • South Redondo Beach
        • Village Oceanview Condos
        • Brookside Village
        • The Esplanade
        • The Avenues
      • Hollywood Riviera
    • Torrrance
      • North Torrance
      • Walteria and Victoria Knolls
      • Central Torrance & Plaza Del Amo
      • Harbor Gateway & County Strip
      • Plaza Del Amo
      • Southwood
      • West Torrance
      • Gated Communities Plaza Del Amo
      • South Torrance
    • Three Sixty South Bay – Gated Resort Style Living
    • Fusion South Bay Townhomes – Gated Community in Hawthorne
    • Foreclosures and Short Sales
    • Hollyglen and Del Aire
    • Harbor City
    • Lomita
  • About
    • Real Estate Trends and Statistics
    • Median Home Prices
    • Recent Home Sales
    • Client Testimonials
    • South Bay Realtor Keith Kyle
    • Vista Sotheby’s
    • Tax Information
      • Capital Gains Tax
      • 1031 Exchange
      • Property Tax FAQs
      • Props 60 and 90
      • Ways of Owning
      • Homeowner’s Exemption
  • Real Estate Blog
  • Home

Real estate and homes for sale in the South Bay

Homes in the Beach Cities and South Bay

September a Big Month for Home Sales in Manhattan Beach

October 13, 2024 by admin

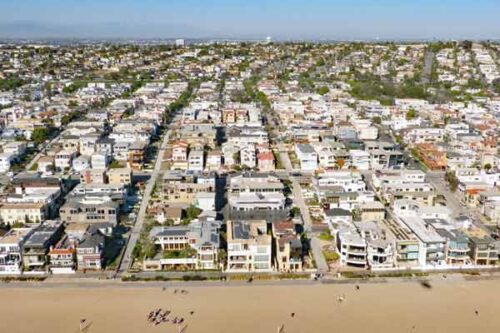
See the Homes that Sold in Manhattan Beach in SeptemberHollywood Rivera yards

Last month was impressive in terms of both the number of home sales and home prices in this luxury community….even by Manhattan Beach standards.

There were 35 homes sold during September 2024 compared  with 19 in August and 28 closed escrows in July.

The average asking price of the homes that sold was $4,876,169 with the average sold price at an incredible $4,647,847.  This was a HUGE jump from the average of  $3,159,579  in August.  

Homes that sold averages $1,525 per square foot which was well above $1,312 in August.  Homes were on the market an average of 75 days on market before going into escrow.

Of the 35 homes that sold, 12 were in the Manhattan Beach sand section, 7 in the tree section, 3 in the hill section, 2 homes  in the gated community of Manhattan Village and 11 in east Manhattan Beach.

The highest price home sale of September was $21,000,000 for an incredible Matt Morris built beachfront home located at 3216 The Strand in the sand section of Manhattan Beach.

See how this compares to other months on our Manhattan Beach real estate trends and statistics page.

September 2024 Home Sales and Home Prices in Manhattan Beach
See what sold!

Type Address Sold Price Beds/Baths Sq Feet Year
SFR/D 4112 Highland AVE $1,470,000 3/2,0,0,0 885/A 1936/ASR
DPLX/D 3104 Highland AVE $2,605,000 3/3,0,0,0 1632/A 1955/ASR
TWNHS/A 1418 Ocean DR $2,699,000 2/2,0,1,0 1391/A 1988/ASR
SFR/D 536 21st ST $2,750,000 4/2,0,0,0 2090/A 1951/ASR
SFR 433 27th ST $3,200,000 4/3,0,0,0 1990/T 1978
SFR/D 544 5th St $3,225,000 4/1,2,0,0 1774/A 1959/ASR
SFR 325 10th ST $3,299,000 5/3,0,0,0 2207/A 1947/ASR
TWNHS/A 319 24th ST $3,684,500 3/3,0,1,0 1900/D 2005/PUB
SFR/D 417 31st ST $4,025,000 3/3,0,1,0 1909/B 2024/BLD
TWNHS/A 2512 Alma $5,325,000 4/3,0,1,0 2576/B 2024/BLD
SFR/D 3208 Ocean DR $8,500,000 3/3,0,1,0 2933/A 2015/ASR
SFR/D 3216 The Strand $21,000,000 5/4,2,0,2 7454/A 2013/ASR
SFR/D 746 27th ST $2,747,500 4/2,0,0,0 1674/A 1952/PUB
SFR/A 738 35th ST $2,925,000 6/1,3,0,0 3047/A 1950/PUB
SFR/D 3004 Palm AVE $3,500,000 4/4,0,0,0 3019/A 1948/ASR
SFR/D 738 19th St $3,875,000 4/3,0,1,0 3378/D 1985/SLR
SFR/D 609 26th ST $4,118,925 5/4,0,0,0 3776/A 1994/ASR
SFR/D 2001 Palm Ave $4,175,000 5/4,0,1,0 3500/E 2006/ASR
SFR/D 746 29th ST $6,900,000 5/2,3,2,0 5527/B 2024/BLD
SFR/D 927 9th Street $3,400,000 4/2,1,0,0 3011/G 1950/ASR
SFR/D 700 John $10,000,000 6/3,1,1,0 4770/A 1962/ASR
SFR/D 808 John St $14,100,000 5/4,0,2,0 6604/A 1998/ASR
TWNHS/A 21 Laguna CT $1,500,000 2/2,0,0,0 1465/A 1984/ASR
CONDO/A 11 Lafayette CT $1,719,455 3/3,0,0,0 1876/A 1985/ASR
SFR/D 1601 23rd ST $1,675,000 3/1,0,0,0 1004/A 1952/ASR
SFR/D 2109 Harkness ST $3,350,000 5/4,0,1,0 3599/B 2013/BLD
SFR/D 1610 21st ST $3,850,000 4/4,0,0,0 3476/A 2023/ASR
TWNHS/A 1155 11th ST #15 $1,250,000 3/3,0,1,0 1542/A 1973/ASR
TWNHS/A 615 Aviation WAY $1,505,000 3/1,1,1,0 1844/B 2022/ASR
SFR/D 1832 9th ST $2,180,000 3/1,0,1,0 1163/A 1958/ASR
SFR/D 1342 9th ST $2,606,250 2/2,0,0,0 2544/A 1953/ASR
SFR 1760 11th ST $3,800,000 5/4,0,1,0 3400/ 2024/BLD
SFR/D 1747 Gates AVE $4,350,000 5/5,0,1,0 4614/A 2017/SEE
SFR/D 1166 Longfellow DR $5,390,000 4/3,0,0,0 2052/A 1954/ASR
SFR/D 1156 6th ST $11,975,000 8/8,0,1,0 8100/A 2020/ASR

Any information relating to a property referenced on this web site comes from CRMLS. This web site may reference real estate listing(s) held by a brokerage firm other than the broker and/or agent who owns this website. The accuracy of all information is deemed reliable but not guaranteed and should be personally verified through personal inspection by and/or with the appropriate professionals

Filed Under: Home Sales, Keith Kyle, Keith Kyle realtor, Manhattan Beach, Manhattan Beach homes, Manhattan Beach real estate, Manhattan Beach Realtors, Manhattan Beach sand section, Manhattan Beach Strand Tagged With: listing agent Keith Kyle, manhattan beach home prices, manhattan beach home sales, manhattan beach real estate market, realtor keith kyle, vista sothebys

Manhattan Beach Home Prices in August 2022

September 7, 2022 by admin

August 2022 at a glance

Manhattan Beach Sold Homes and Home Prices

There was a slight slow down for home sales in August  with only 28 on market homes closing escrow during the month.  That was compared with 36 sold homes in July and 33 in June.

The average sales price declined dramatically from July in which home prices averaged almost $4.5M but the average sales prices were impacted significantly in July with 3 big beachfront home sales on the Manhattan Strand.

The average asking price in August was $3,370,679 with the average sold home price at $3,377,604 meaning that homes generally sold aroundat full price or higher.

The average price per foot was $1554 and median days on market was a very brief 28 days before going into pending status.  The average days on market was 28.  See how this compares to other months on our Manhattan Beach real estate trends and statistics page.

August 2022 Home Prices in Manhattan Beach

Style Address Price $ Per Foot Bed/Bath Sq Ft Age
SFR/D 226 44th St $1,570,000 $2,236 1/0,1,0,0 702/A 1948/ASR
SFR/D 2613 Vista DR $2,700,000 $1,471 3/2,0,0,0 1836/A 1968/ASR
SFR/D 209 15th ST $2,885,000 $2,219 3/1,1,0,0 1300/E 1961/ASR
SFR/D 512 2nd Street $3,200,000 $1,817 4/1,1,1,0 1761/A 1972/ASR
DPLX/A 401 18th ST $3,780,000 $1,535 5/2,2,1,0 2463/A 1968/ASR
TWNHS/A 4114 The Strand $4,125,000 $1,833 4/4,0,2,0 2250/A 2008/PUB
CONDO/A 1208 The Strand #A $4,850,000 $4,076 2/2,0,0,0 1190/A 1969/ASR
SFR/D 1900 The Strand $15,573,900 $4,284 2/3,0,0,0 3635/A 1980/ASR
SFR 716 Rosecrans AVE $2,350,000 $1,567 3/2,0,0,0 1500/OTH 1957
TWNHS 760 CENTER PL $2,570,000 $1,134 3/3,0,0,0 2267/ 2017/BLD
SFR/D 600 26th ST $2,750,000 $1,964 3/2,0,0,0 1400/A 1959/ASR
SFR/D 2209 N Valley DR $3,475,000 $986 4/2,0,1,0 3524/A 1980/ASR
SFR/D 632 26th ST $4,000,000 $1,142 4/4,0,0,0 3502/T 1989/OTH
SFR/D 2311 Palm AVE $4,350,000 $1,212 4/4,0,0,0 3588/A 1994/ASR
SFR/D 562 33rd ST $4,460,000 $1,257 5/4,0,0,0 3548/A 2003/ASR
SFR/D 1817 Elm AVE $4,500,000 $1,413 5/4,0,0,0 3184/A 1999/ASR
SFR/D 1023 11th ST $2,210,000 $1,300 4/2,0,0,0 1700/E 1954/ASR
TWNHS/A 1116 N Ardmore AVE $2,575,000 $1,420 3/2,0,1,0 1814/A 2002/ASR
TWNHS/A 7 Laguna CT $1,725,000 $920 3/2,0,1,0 1876/A 1984/ASR
TWNHS/A 36 Dover PL $2,010,000 $983 3/2,0,1,0 2045/D 1987/PUB
SFR/D 1812 Marine AVE $1,875,000 $967 4/0,2,1,0 1938/A 1954/ASR
TWNHS/D 1323 17th ST #2 $2,000,000 $548 4/3,0,1,0 3653/A 1991/ASR
TWNHS/A 1155 11th ST #8 $1,180,000 $765 2/2,0,1,0 1542/A 1973/ASR
SFR/D 1331 Gates AVE $1,800,000 $1,141 3/1,1,0,0 1578/A 1951/ASR
DPLX/A 1627 Ruhland AVE $2,220,000 $2,094 2/2,0,0,0 1060/A 1951/PUB
SFR/D 1837 8th ST $2,850,000 $1,259 3/2,0,1,0 2264/A 1977/ASR
SFR/D 1761 10th ST $3,190,000 $1,024 4/3,0,0,0 3114/A 1987/ASR
SFR/D 1337 9th ST $3,799,000 $953 5/4,1,1,0 3988/A 2002/ASR

Filed Under: Beachfront homes, Home Sales, Manhattan Beach, Manhattan Beach homes, Manhattan Beach real estate, Manhattan Beach Realtors Tagged With: manhattan beach august home sales, manhattan beach home prices, manhattan beach home sales, manhattan beach real estate, manhattan beach real estate market

Manhattan Beach Real Estate Trends and Statistics

September 17, 2021 by admin

Let’s take a look at the past year in Manhattan Beach and see where the Manhattan Beach real estate market might be heading.  The big story is that inventory just keeps going down.  July of 2020 saw 134 active homes for sale while July 2021 only offered 64 and that dropped even further in August.  View the current homes for sale in Manhattan Beach CA

  • See also South Bay real estate trends
  • Sand Section real estate trends
  • Tree section real estate trends & statistics
  • Hill section real estate trends
  • Manhattan Village real estate statistics
  • East Manhattan real estate statistics

Manhattan Beach Real Estate Market Trends and Statistics

Current number of homes for sale as well as pending home sales and recent sales

Average Price Per Square Foot in Manhattan Beach (keep in mind that this is often not the best determinant of value due to proximity to the beach, age, views, etc.

Days on Market (columns) and % of list price homes sold at
Average Price of For Sale Homes and Sold Homes
Months of Housing Inventory Based on Closed Home Sales

Filed Under: Manhattan Beach, Manhattan Beach homes, Manhattan Beach real estate, Manhattan Beach Realtors, Manhattan Beach sand section, Manhattan Villlage, Market update Tagged With: homes for sale in manhattan beach, manhattan beach real estate market, manhattan beach real estate trends

Manhattan Beach Real Estate Recap – August Home Sales

September 7, 2021 by admin

Welcome to the real estate recap for August 2021 for the luxury coastal community of Manhattan Beach CA.  It was another incredible month for home sales in Manhattan Beach with an impressive 55 on market home sales. The average list price was $2,963,145 with the average “sold” price of $2,981,462. Homes averaged only 39 days on market before going into escrow and the average price per foot was an impressive $1,314.  The top on market sale of the month (there was an off market sale slightly higher) was for a walkstreet home at 316 20th Street that sold for $7,000,000.  Of the 55 homes that sold the breakdown was:

  • 18 home sales in the sand section
  • 15 home sales in the tree section
  • 3 home sales in the hill section
  • 1 home sale in Manhattan Village
  • 18 home sales in East Manhattan Beach

See how this compares with other months on our Manhattan Beach CA real estate trends and statisics page.

Search for homes in Manhattan Beach

August 2021 Home Sales and Property Prices in Manhattan Beach California

Type Address Price $ Per Foot Bed/Bath Sq Feet Year Sold Date
SFR/D 457 28th ST $2,050,000 $2,356.32 2/1,0,0,0 870/A 1952/OTH 8/9/2021
TWNHS/D 4220 Ocean DR #1 $2,187,500 $1,438.20 2/2,0,1,0 1521/P 1979/PUB 8/31/2021
TWNHS/A 220 43rd ST $2,200,000 $1,167.73 3/3,0,1,0 1884/A 2002/ASR 8/12/2021
SFR/D 532 Marine Avenue $2,300,000 $1,885.25 3/1,0,1,0 1220/AP 1951/APP 8/3/2021
TWNHS/A 333 21st PL $2,525,000 $1,392.72 3/3,0,1,0 1813/OTH 2006/PUB 8/31/2021
TWNHS/A 324 21st ST $2,775,000 $1,455.93 3/4,0,0,0 1906/A 1994/ASR 8/31/2021
SFR 433 27Th ST $2,850,000 $1,463.79 4/3,0,0,0 1947/ 1978 8/20/2021
SFR/D 464 35th ST $3,000,000 $975.93 4/3,0,0,0 3074/A 1988/ASR 8/27/2021
TWNHS/D 712 Highland AVE $3,160,000 $1,606.51 3/4,0,0,0 1967/A 1988/ASR 8/12/2021
TWNHS/A 319 24th ST $3,200,000 $1,684.21 3/3,0,0,0 1900/A 2005/PUB 8/6/2021
TPLX/D 3101 Highland AVE $3,340,000 $1,518.18 5/4,0,0,0 2200/A 1935/ASR 8/10/2021
TWNHS/A 218 1st PL $3,393,750 $1,686.75 3/3,0,1,0 2012/E 2018/ASR 8/18/2021
TPLX/D 2408 Highland AVE $3,700,000 $1,173.49 5/4,0,0,0 3153/A 1960/ASR 8/4/2021
SFR/D 229 30th ST $3,895,000 $2,263.22 3/1,1,0,0 1721/A 1954/ASR 8/11/2021
TWNHS/A 2305 Bayview DR $3,925,000 $1,527.24 3/1,2,1,0 2570/A 2004/ASR 8/12/2021
TWNHS 121 15Th ST $4,100,000 $2,157.89 3/3,0,1,0 1900/O 2005/ASR 8/6/2021
SFR/D 316 20th ST $7,000,000 $1,636.28 5/5,0,2,0 4278/D 2021/BLD 8/6/2021
SFR/D 461 26th ST $7,150,000 $1,662.79 6/5,0,1,0 4300/D 2021/PUB 8/18/2021
SFR/D 2801 N Valley DR $1,630,000 $1,689.12 2/1,0,0,0 965/A 1951/ASR 8/17/2021
SFR 760 Rosecrans AVE $1,645,000 $1,566.67 2/1,1,0,0 1050/OTH 1954 8/2/2021
SFR 632 36Th ST $1,700,000 $1,650.49 2/1,0,0,0 1030/ 1948 8/9/2021
SFR/D 3212 Oak AVE $1,865,000 $1,410.74 3/2,0,0,0 1322/P 1952/PUB 8/17/2021
SFR/D 3201 Laurel AVE $1,915,000 $1,574.84 3/2,0,0,0 1216/A 1951/ASR 8/13/2021
SFR/D 720 Rosecrans AVE $2,100,000 $1,011.56 4/3,0,1,0 2076/A 1955/PUB 8/9/2021
SFR 746 29Th ST $2,310,000 $1,834.79 4/2,0,0,0 1259/ 1947 8/16/2021
SFR/D 2510 Laurel Ave $2,475,000 $1,213.24 3/2,1,0,0 2040/A 1956/ASR 8/25/2021
SFR/D 2317 Elm AVE $2,548,000 $1,119.02 4/3,0,0,0 2277/A 1957/ASR 8/24/2021
SFR/D 1712 N Poinsettia AVE $3,125,000 $1,129.38 4/2,0,1,0 2767/A 1996/ASR 8/12/2021
SFR/D 717 29th ST $3,364,675 $975.83 5/4,0,0,0 3448/A 1997/APP 8/3/2021
SFR/A 2201 Oak AVE $3,450,000 $995.10 5/5,0,1,0 3467/A 2017/ASR 8/2/2021
SFR/D 3211 Poinsettia AVE $4,000,000 $727.27 5/4,0,0,0 5500/S 1981/ASR 8/5/2021
SFR/D 3000 Palm AVE $4,200,000 $1,170.57 5/5,0,0,0 3588/B 2017/ASR 8/6/2021
SFR 3412 Palm AVE $5,950,000 $1,053.10 6/6,0,0,0 5650/B 2020/BLD 8/10/2021
SFR/D 612 Anderson ST $2,300,000 $1,347.39 3/2,0,0,0 1707/E 1966/ASR 8/16/2021
SFR/D 931 Duncan AVE $2,655,000 $2,085.62 3/1,0,0,0 1273/A 1950/ASR 8/2/2021
SFR/D 504 N Poinsettia AVE $7,000,000 $1,523.06 5/3,1,1,0 4596/A 2001/ASR 8/13/2021
TWNHS 1 Tiburon CT $1,970,000 $998.99 3/3,0,0,0 1972/ 1987 8/24/2021
SFR/D 1209 N Meadows AVE $1,400,000 $1,422.76 3/1,0,0,0 984/A 1947/ASR 8/12/2021
SFR/D 1908 Wendy WAY $1,465,000 $1,053.96 3/2,0,0,0 1390/A 1950/ASR 8/2/2021
SFR/D 1228 23rd ST $1,525,000 $1,336.55 2/1,0,0,0 1141/A 1948/ASR 8/16/2021
SFR/D 1610 23rd ST $1,700,000 $992.41 3/2,0,0,0 1713/A 1952/ASR 8/20/2021
SFR/D 2200 Chestnut AVE $2,660,000 $846.06 4/3,0,0,0 3144/A 1989/ASR 8/24/2021
SFR/D 1335 19th ST $3,965,000 $791.42 6/5,0,1,0 5010/P 2010/BLD 8/13/2021
TWNHS/A 1140 Manhattan Beach BLVD #C $1,120,000 $933.33 2/3,0,0,0 1200/S 1978/ASR 8/4/2021
TWNHS/A 1821 11th ST $1,405,000 $984.58 2/1,1,0,0 1427/B 2021/BLD 8/17/2021
TWNHS/A 1827 11th ST $1,410,000 $988.09 2/1,1,0,0 1427/B 2021/BLD 8/31/2021
SFR/A 1627 Ruhland AVE $1,850,000 $1,745.28 2/2,0,0,0 1060/A 1951/PUB 8/31/2021
SFR 1822 8th ST $2,485,000 $1,215.16 3/2,0,0,0 2045/O 1953/ASR 8/24/2021
SFR/D 1301 5th ST $2,800,000 $1,055.81 4/1,1,1,0 2652/A 1964/ASR 8/11/2021
SFR/D 1657 Gates Ave $3,150,000 $750.54 4/3,2,0,0 4197/D 1948/PUB 8/17/2021
SFR/D 1622 9th ST $3,450,000 $760.75 5/5,0,1,0 4535/P 2002/PUB 8/13/2021
SFR/D 405 S Prospect AVE $3,516,500 $754.94 6/4,0,0,0 4658/B 2007/BLD 8/6/2021
SFR/D 1613 5th ST $3,550,000 $806.82 5/4,0,1,0 4400/A 1992/PUB 8/3/2021
SFR/D 1511 2nd ST $3,675,000 $789.13 4/4,0,0,0 4657/A 2016/ASR 8/13/2021
SFR/D 1541 5th ST $3,900,000 $958.00 5/4,0,1,0 4071/O 2009/SLR 8/24/2021

Filed Under: Manhattan Beach homes, Manhattan Beach real estate, Market update Tagged With: manhattan beach home prices, manhattan beach home sales, manhattan beach real estate market

Market Snapshot for Manhattan Beach Real Estate

May 14, 2020 by admin

While you’re stuck at home why not sit back and get an understanding of what’s happening in our local real estate market.South Manhattan Beach
April 2020 saw a big drop in the number of home sale with 20 closed escrows compared wtih 44 a year earlier.  Average days on market was only 41 and the median sales price was a whopping $3,540,000.  View the Manhattan Beach homes that sold in April 2020.

View the historical Manhattan Beach real estate statistics and trends as well as the current homes for sale in Manhattan Beach California.

Filed Under: Manhattan Beach, Manhattan Beach homes, Manhattan Beach real estate, Manhattan Beach Realtors Tagged With: manhattan beach home prices, manhattan beach homes, manhattan beach market, manhattan beach real estate, manhattan beach real estate market, median home prices in manhattan beach, real estate in manhattan beach

Featured Home of the Week

https://www.youtube.com/watch?v=CdFG-D0B5Ac

Recent Manhattan Listings

See all Manhattan Beach Homes for Sale

Recent Redondo Listings

See all Redondo Beach Homes for Sale

Your South Bay Realtor

Keith Kyle

Realtor, Top Producing Agent Since 2007

Top 1.5% of Realtors Nationwide 2021

310.251.2344 (cell/text) Keith@KeithKyleHomes.com DRE# 01718725

South Bay Real Estate

Search Our Site

Keith Kyle Homes logo
 
Manhattan Beach
Hermosa Beach
North Redondo
South Redondo
El Segundo
Torrance
Palos Verdes Estates
Rancho Palos Verdes
Hollywood Riviera
Hollyglen
Lawndale
Hawthorne
Gardena
Manhattan Village
Rolling Hills Estates
MB Sand Section
MB Tree Section
MB Hill Section
East Manhattan
Oceanfront Homes
The multiple listing data appearing on this website, or contained in reports produced therefrom, is owned and copyrighted by California Regional Multiple Listing Service, Inc. ("CRMLS") and is protected by all applicable copyright laws. All listing data, including but not limited to square footage and lot size is believed to be accurate, but the listing Agent, listing Broker and CRMLS and its affiliates do not warrant or guarantee such accuracy. The viewer should independently verify the listed data prior to making any decisions based on such information by personal inspection and/or contacting a real estate professional. The information being provided by CRMLS & CARETS is for the visitor's personal, noncommercial use and may not be used for any purpose other than to identify prospective properties visitor may be interested in purchasing. The data contained herein is copyrighted by CARETS, CLAW, CRISNet MLS, i-Tech MLS, PSRMLS and/or VCRDS and is protected by all applicable copyright laws. Any dissemination of this information is in violation of copyright laws and is strictly prohibited. Any property information referenced on this website comes from the Internet Data Exchange (IDX) program of CRISNet MLS and/or CARETS. All data, including all measurements and calculations of area, is obtained from various sources and has not been, and will not be, verified by broker or MLS. All information should be independently reviewed and verified for accuracy. Properties may or may not be listed by the office/agent presenting the information.


Please see our pledge to web accessibility

  • El Segundo
  • Hermosa Beach
  • Three Sixty
  • Manhattan Beach
  • PVE
  • RPV
  • Redondo Beach
  • Torrance
  • Fusion