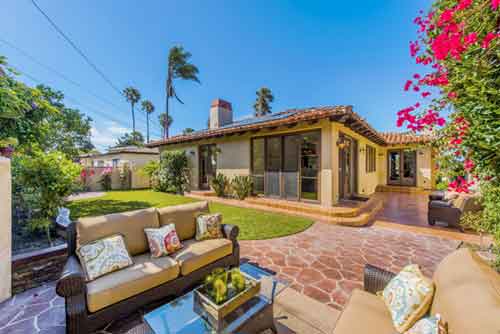
• Find a Home
    • Search by City or Neighborhood
    • South Bay RE News
    • Open Houses
      • Open Houses in El Segundo CA
      • Manhattan Beach Open Houses
      • Redondo Beach Open Houses
      • Torrance Open Houses
      • Hermosa Beach Open Houses
      • Palos Verdes Estates Open Houses
      • Rancho Palos Verdes Open Houses
      • Hawthorne CA Open Houses
    • All Manhattan Beach
      • Hill Section
      • Sand Section
      • Tree Section
      • Manhattan Village
      • East Manhattan Beach
      • East Manhattan – S of MB Blvd
      • Liberty Village
    • All Redondo Beach
      • North Redondo Beach
      • South Redondo Beach
      • The Village and Seascape
    • Hermosa Beach
    • El Segundo
    • Torrance
    • Palos Verdes
      • Palos Verdes Estates
      • Rancho Palos Verdes
      • Rolling Hills
      • Rolling Hills Estates
    • Hollywood Riviera
    • Hawthorne
      • Hollyglen and Del Aire
        • Three Sixty South Bay
        • Fusion South Bay
    • 55+ Senior Communities
    • Oceanfront Homes
    • Lawndale
    • Gardena
    • Marina Del Rey
    • Westchester
  • FREE Listing Updates
    • Entire South Bay
    • Manhattan Beach
    • Redondo Beach
    • Hawthorne, Hollyglen, 360 and Fusion
    • Torrance
    • Plaza Del Amo
  • Buyers
    • Search South Bay Homes
    • Search for homes
    • Buyer & Seller FAQs
      • Helpful Home Buyer Tips and Questions
      • First Time Home Buyer Tips
  • Sellers
    • Your Home’s Value
    • Recent South Bay Sales
    • Our Listing Presentation
    • What’s A CMA?
    • Listing and Selling
    • How We Market Homes
    • How We Sell Homes
    • Client Testimonials
  • Neighborhoods
    • Search by Neighborhood
    • Schools
      • El Segundo Schools
      • Hermosa Beach Schools
      • Redondo Beach Schools
      • Wiseburn School District
      • Torrance Schools
      • Manhattan Beach Schools
        • Manhattan School Boundary Map
        • Homes in Meadows area
        • Homes in Pennekamp area
        • Homes in Pacific area
        • Homes in Robinson area
        • Homes in Grandview area
      • Palos Verdes School District
      • Lawndale School District
        • Lawndale School Boundary Map
    • Manhattan Beach
      • Sand Section
      • Manhattan Village
      • Tree Section
      • Hill Section
      • East Manhattan
    • Redondo Beach
      • North Redondo Beach
        • The Golden Hills
      • South Redondo Beach
        • Village Oceanview Condos
        • Brookside Village
        • The Esplanade
        • The Avenues
      • Hollywood Riviera
    • Hermosa Beach
    • Torrrance
      • North Torrance
      • Walteria and Victoria Knolls
      • Central Torrance & Plaza Del Amo
      • Harbor Gateway & County Strip
      • Plaza Del Amo
      • Southwood
      • West Torrance
      • Gated Communities Plaza Del Amo
      • South Torrance
    • Three Sixty South Bay
    • Fusion South Bay
    • El Segundo
    • Palos Verdes
      • Real Estate Map
    • Foreclosures and Short Sales
    • Hollyglen and Del Aire
    • Lawndale
    • Harbor City
    • Lomita
    • Hawthorne
  • About
    • Real Estate Trends and Statistics
    • Median Home Prices
    • Recent Home Sales
    • Client Testimonials
    • South Bay Realtor Keith Kyle
    • Vista Sotheby’s
    • Tax Information
      • Capital Gains Tax
      • 1031 Exchange
      • Property Tax FAQs
      • Props 60 and 90
      • Ways of Owning
      • Homeowner’s Exemption
  • Real Estate Blog
  • Home

Search real estate and homes for sale in the South Bay

Real Estate and homes for sale in Manhattan Beach, Redondo Beach, Hermosa, Torrance and El Segundo

Manhattan Beach Real Estate Trends and Statistics

September 17, 2021 by admin

Let’s take a look at the past year in Manhattan Beach and see where the Manhattan Beach real estate market might be heading.  The big story is that inventory just keeps going down.  July of 2020 saw 134 active homes for sale while July 2021 only offered 64 and that dropped even further in August.  View the current homes for sale in Manhattan Beach CA

  • See also South Bay real estate trends
  • Sand Section real estate trends
  • Tree section real estate trends & statistics
  • Hill section real estate trends
  • Manhattan Village real estate statistics
  • East Manhattan real estate statistics

Manhattan Beach Real Estate Market Trends and Statistics

Current number of homes for sale as well as pending home sales and recent sales

Average Price Per Square Foot in Manhattan Beach (keep in mind that this is often not the best determinant of value due to proximity to the beach, age, views, etc.

Days on Market (columns) and % of list price homes sold at
Average Price of For Sale Homes and Sold Homes
Months of Housing Inventory Based on Closed Home Sales

Filed Under: Manhattan Beach, Manhattan Beach homes, Manhattan Beach real estate, Manhattan Beach Realtors, Manhattan Beach sand section, Manhattan Villlage, Market update Tagged With: homes for sale in manhattan beach, manhattan beach real estate market, manhattan beach real estate trends

Manhattan Beach Real Estate Recap – August Home Sales

September 7, 2021 by admin

Welcome to the real estate recap for August 2021 for the luxury coastal community of Manhattan Beach CA.  It was another incredible month for home sales in Manhattan Beach with an impressive 55 on market home sales. The average list price was $2,963,145 with the average “sold” price of $2,981,462. Homes averaged only 39 days on market before going into escrow and the average price per foot was an impressive $1,314.  The top on market sale of the month (there was an off market sale slightly higher) was for a walkstreet home at 316 20th Street that sold for $7,000,000.  Of the 55 homes that sold the breakdown was:

  • 18 home sales in the sand section
  • 15 home sales in the tree section
  • 3 home sales in the hill section
  • 1 home sale in Manhattan Village
  • 18 home sales in East Manhattan Beach

See how this compares with other months on our Manhattan Beach CA real estate trends and statisics page.

Search for homes in Manhattan Beach

August 2021 Home Sales and Property Prices in Manhattan Beach California

Type Address Price $ Per Foot Bed/Bath Sq Feet Year Sold Date
SFR/D 457 28th ST $2,050,000 $2,356.32 2/1,0,0,0 870/A 1952/OTH 8/9/2021
TWNHS/D 4220 Ocean DR #1 $2,187,500 $1,438.20 2/2,0,1,0 1521/P 1979/PUB 8/31/2021
TWNHS/A 220 43rd ST $2,200,000 $1,167.73 3/3,0,1,0 1884/A 2002/ASR 8/12/2021
SFR/D 532 Marine Avenue $2,300,000 $1,885.25 3/1,0,1,0 1220/AP 1951/APP 8/3/2021
TWNHS/A 333 21st PL $2,525,000 $1,392.72 3/3,0,1,0 1813/OTH 2006/PUB 8/31/2021
TWNHS/A 324 21st ST $2,775,000 $1,455.93 3/4,0,0,0 1906/A 1994/ASR 8/31/2021
SFR 433 27Th ST $2,850,000 $1,463.79 4/3,0,0,0 1947/ 1978 8/20/2021
SFR/D 464 35th ST $3,000,000 $975.93 4/3,0,0,0 3074/A 1988/ASR 8/27/2021
TWNHS/D 712 Highland AVE $3,160,000 $1,606.51 3/4,0,0,0 1967/A 1988/ASR 8/12/2021
TWNHS/A 319 24th ST $3,200,000 $1,684.21 3/3,0,0,0 1900/A 2005/PUB 8/6/2021
TPLX/D 3101 Highland AVE $3,340,000 $1,518.18 5/4,0,0,0 2200/A 1935/ASR 8/10/2021
TWNHS/A 218 1st PL $3,393,750 $1,686.75 3/3,0,1,0 2012/E 2018/ASR 8/18/2021
TPLX/D 2408 Highland AVE $3,700,000 $1,173.49 5/4,0,0,0 3153/A 1960/ASR 8/4/2021
SFR/D 229 30th ST $3,895,000 $2,263.22 3/1,1,0,0 1721/A 1954/ASR 8/11/2021
TWNHS/A 2305 Bayview DR $3,925,000 $1,527.24 3/1,2,1,0 2570/A 2004/ASR 8/12/2021
TWNHS 121 15Th ST $4,100,000 $2,157.89 3/3,0,1,0 1900/O 2005/ASR 8/6/2021
SFR/D 316 20th ST $7,000,000 $1,636.28 5/5,0,2,0 4278/D 2021/BLD 8/6/2021
SFR/D 461 26th ST $7,150,000 $1,662.79 6/5,0,1,0 4300/D 2021/PUB 8/18/2021
SFR/D 2801 N Valley DR $1,630,000 $1,689.12 2/1,0,0,0 965/A 1951/ASR 8/17/2021
SFR 760 Rosecrans AVE $1,645,000 $1,566.67 2/1,1,0,0 1050/OTH 1954 8/2/2021
SFR 632 36Th ST $1,700,000 $1,650.49 2/1,0,0,0 1030/ 1948 8/9/2021
SFR/D 3212 Oak AVE $1,865,000 $1,410.74 3/2,0,0,0 1322/P 1952/PUB 8/17/2021
SFR/D 3201 Laurel AVE $1,915,000 $1,574.84 3/2,0,0,0 1216/A 1951/ASR 8/13/2021
SFR/D 720 Rosecrans AVE $2,100,000 $1,011.56 4/3,0,1,0 2076/A 1955/PUB 8/9/2021
SFR 746 29Th ST $2,310,000 $1,834.79 4/2,0,0,0 1259/ 1947 8/16/2021
SFR/D 2510 Laurel Ave $2,475,000 $1,213.24 3/2,1,0,0 2040/A 1956/ASR 8/25/2021
SFR/D 2317 Elm AVE $2,548,000 $1,119.02 4/3,0,0,0 2277/A 1957/ASR 8/24/2021
SFR/D 1712 N Poinsettia AVE $3,125,000 $1,129.38 4/2,0,1,0 2767/A 1996/ASR 8/12/2021
SFR/D 717 29th ST $3,364,675 $975.83 5/4,0,0,0 3448/A 1997/APP 8/3/2021
SFR/A 2201 Oak AVE $3,450,000 $995.10 5/5,0,1,0 3467/A 2017/ASR 8/2/2021
SFR/D 3211 Poinsettia AVE $4,000,000 $727.27 5/4,0,0,0 5500/S 1981/ASR 8/5/2021
SFR/D 3000 Palm AVE $4,200,000 $1,170.57 5/5,0,0,0 3588/B 2017/ASR 8/6/2021
SFR 3412 Palm AVE $5,950,000 $1,053.10 6/6,0,0,0 5650/B 2020/BLD 8/10/2021
SFR/D 612 Anderson ST $2,300,000 $1,347.39 3/2,0,0,0 1707/E 1966/ASR 8/16/2021
SFR/D 931 Duncan AVE $2,655,000 $2,085.62 3/1,0,0,0 1273/A 1950/ASR 8/2/2021
SFR/D 504 N Poinsettia AVE $7,000,000 $1,523.06 5/3,1,1,0 4596/A 2001/ASR 8/13/2021
TWNHS 1 Tiburon CT $1,970,000 $998.99 3/3,0,0,0 1972/ 1987 8/24/2021
SFR/D 1209 N Meadows AVE $1,400,000 $1,422.76 3/1,0,0,0 984/A 1947/ASR 8/12/2021
SFR/D 1908 Wendy WAY $1,465,000 $1,053.96 3/2,0,0,0 1390/A 1950/ASR 8/2/2021
SFR/D 1228 23rd ST $1,525,000 $1,336.55 2/1,0,0,0 1141/A 1948/ASR 8/16/2021
SFR/D 1610 23rd ST $1,700,000 $992.41 3/2,0,0,0 1713/A 1952/ASR 8/20/2021
SFR/D 2200 Chestnut AVE $2,660,000 $846.06 4/3,0,0,0 3144/A 1989/ASR 8/24/2021
SFR/D 1335 19th ST $3,965,000 $791.42 6/5,0,1,0 5010/P 2010/BLD 8/13/2021
TWNHS/A 1140 Manhattan Beach BLVD #C $1,120,000 $933.33 2/3,0,0,0 1200/S 1978/ASR 8/4/2021
TWNHS/A 1821 11th ST $1,405,000 $984.58 2/1,1,0,0 1427/B 2021/BLD 8/17/2021
TWNHS/A 1827 11th ST $1,410,000 $988.09 2/1,1,0,0 1427/B 2021/BLD 8/31/2021
SFR/A 1627 Ruhland AVE $1,850,000 $1,745.28 2/2,0,0,0 1060/A 1951/PUB 8/31/2021
SFR 1822 8th ST $2,485,000 $1,215.16 3/2,0,0,0 2045/O 1953/ASR 8/24/2021
SFR/D 1301 5th ST $2,800,000 $1,055.81 4/1,1,1,0 2652/A 1964/ASR 8/11/2021
SFR/D 1657 Gates Ave $3,150,000 $750.54 4/3,2,0,0 4197/D 1948/PUB 8/17/2021
SFR/D 1622 9th ST $3,450,000 $760.75 5/5,0,1,0 4535/P 2002/PUB 8/13/2021
SFR/D 405 S Prospect AVE $3,516,500 $754.94 6/4,0,0,0 4658/B 2007/BLD 8/6/2021
SFR/D 1613 5th ST $3,550,000 $806.82 5/4,0,1,0 4400/A 1992/PUB 8/3/2021
SFR/D 1511 2nd ST $3,675,000 $789.13 4/4,0,0,0 4657/A 2016/ASR 8/13/2021
SFR/D 1541 5th ST $3,900,000 $958.00 5/4,0,1,0 4071/O 2009/SLR 8/24/2021

Filed Under: Manhattan Beach homes, Manhattan Beach real estate, Market update Tagged With: manhattan beach home prices, manhattan beach home sales, manhattan beach real estate market

Manhattan Beach Real Estate Overview – February at a Glance

March 26, 2021 by admin

Welcome to the real estate recap for the city of Manhattan Beach.  February was yet another great month for home sales in Manhattan Beach with 27 homes selling during the month.  Historically that was a bit low but higher than the 22 from a year earlier.  The median sals price was $3,211,000 and the average days on market was 53.    Take a look at the homes that sold and the house prices in February.

Search the current homes for sale in Manhattan Beach

Filed Under: Manhattan Beach, Manhattan Beach homes, Manhattan Beach real estate, Manhattan Beach Realtors, Market update Tagged With: manhattan beach homes, manhattan beach real estate

Waiting for a Foreclosures or Short Sale “Deal”? Here’s Why You Can’t Find One

December 1, 2020 by admin

As we are short sale specialists from the abundance of short sales we were involved in when the market went south years ago, we’re often contacted by home buyers looking for a “deal”……meaning a distressed home sale including bank owned homes (REOs) and short sales.  Here’s a chart that shows why currently that’s just about impossible.  Keep in mind that this is all combined short sales and REOs for all the listed cities in the South Bay.

Filed Under: Home Sales, Homebuyers, Manhattan Beach real estate, Market update, Neighborhoods, Palos Verdes, Rancho Palos Verdes, Redondo Beach, Rolling Hills, Rolling Hills Estates, South Bay, Torrance Tagged With: foreclosures, reos bank owned homes, short sale specialist, short sales

Palos Verdes Estates Real Estate – At a Glance

May 17, 2020 by admin

April 2020 was certainly a slower month for home sales in Palos Verdes Estates with only 9 homes selling during the month.  This was compared with 16 home sales the year earlier which is obviously a significant drop.  The median sales prices was an impressive $2,260,000 with the average days on market at 47.  Price per foot for the homes that sold was $722.

View all of the current homes for sale in Palos Verdes Estates

Filed Under: Market update, Palos Verdes, Palos Verdes Estates, Real Estate Tagged With: palos verdes estates, palos verdes estates real estate, pve

Real Estate Update for South Redondo Beach – Trends and Statistics

April 8, 2020 by admin

Keep up with the real estate market in South Redondo Beach.  South Redondo, or homes in the 90277 zip are generally more expensive than the equivalent homes in North Redondo…..why?   The primary reason is location as South Redondo extends all the way to the beach along the Esplanade, whereas homes in North Redondo are a car ride or longer walk/bike ride from the beach.  Take a look below at the most recent real estate trends and statistics for only the 90277 zip in South Redondo Beach.

View the current homes for sale in the 90277 zip code area of South Redondo Beach CA

The chart below displays the number of rcent active homes for sale (light green) pending sales (red line) and closed home sales (dark green)

The chart below shows the average price per square feet for all types of homes in 90277


The chart below shows average days on market as well as the % that the homes sold compared with the asking price.


The chart below shows the average list price in South Redondo Beach and the average sales price.


The chart below shows the months of inventory for all home types in South Redondo Beach based on the recent number of closed home sales


Filed Under: Helpful real estate information, Home Sales, Home Sellers, Market update, Redondo Beach, South Redondo Tagged With: 90277 home sales, 90277 homes for sale, 90277 real estate, south redondo beach, south redondo beach real estate market, south redondo homes, south redondo real estate, south redondo real estate statistics, south redondo real estate trends

  • 1
  • 2
  • Next Page »

Own Your Piece of the South Bay Lifestyle

https://youtu.be/SJcrcHl9U5Y

Recent Manhattan Listings

See all Manhattan Beach Homes for Sale

Recent Redondo Listings

See all Redondo Beach Homes for Sale

Your South Bay Realtor

Keith Kyle

Realtor, Top Producing Agent Since 2007 310.251.2344 (cell/text) Keith@KeithKyleHomes.com DRE# 01718725

South Bay Real Estate

Search Our Site

 
Manhattan Beach
Hermosa Beach
North Redondo
South Redondo
El Segundo
Torrance
Palos Verdes Estates
Rancho Palos Verdes
Hollywood Riviera
Hollyglen
Lawndale
Hawthorne
Gardena
Manhattan Village
Rolling Hills Estates
MB Sand Section
MB Tree Section
MB Hill Section
East Manhattan
Oceanfront Homes
The multiple listing data appearing on this website, or contained in reports produced therefrom, is owned and copyrighted by California Regional Multiple Listing Service, Inc. ("CRMLS") and is protected by all applicable copyright laws. All listing data, including but not limited to square footage and lot size is believed to be accurate, but the listing Agent, listing Broker and CRMLS and its affiliates do not warrant or guarantee such accuracy. The viewer should independently verify the listed data prior to making any decisions based on such information by personal inspection and/or contacting a real estate professional. The information being provided by CRMLS & CARETS is for the visitor's personal, noncommercial use and may not be used for any purpose other than to identify prospective properties visitor may be interested in purchasing. The data contained herein is copyrighted by CARETS, CLAW, CRISNet MLS, i-Tech MLS, PSRMLS and/or VCRDS and is protected by all applicable copyright laws. Any dissemination of this information is in violation of copyright laws and is strictly prohibited. Any property information referenced on this website comes from the Internet Data Exchange (IDX) program of CRISNet MLS and/or CARETS. All data, including all measurements and calculations of area, is obtained from various sources and has not been, and will not be, verified by broker or MLS. All information should be independently reviewed and verified for accuracy. Properties may or may not be listed by the office/agent presenting the information.
  • El Segundo
  • Hermosa Beach
  • Three Sixty
  • Manhattan Beach
  • PVE
  • RPV
  • Redondo Beach
  • Torrance
  • Fusion