Let’s take a look at the past year in Manhattan Beach and see where the Manhattan Beach real estate market might be heading. The big story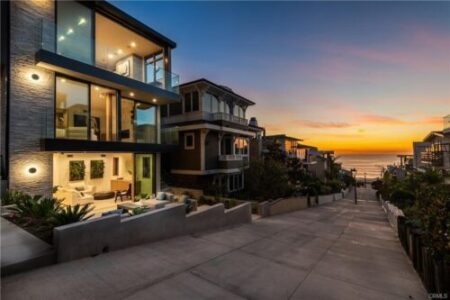 is that inventory just keeps going down. July of 2020 saw 134 active homes for sale while July 2021 only offered 64 and that dropped even further in August. View the current homes for sale in Manhattan Beach CA
- See also South Bay real estate trends
- Sand Section real estate trends
- Tree section real estate trends & statistics
- Hill section real estate trends
- Manhattan Village real estate statistics
- East Manhattan real estate statistics
Manhattan Beach Real Estate Market Trends and Statistics
Current number of homes for sale as well as pending home sales and recent sales
Average Price Per Square Foot in Manhattan Beach (keep in mind that this is often not the best determinant of value due to proximity to the beach, age, views, etc.
Days on Market (columns) and % of list price homes sold at
Average Price of For Sale Homes and Sold Homes
Months of Housing Inventory Based on Closed Home Sales
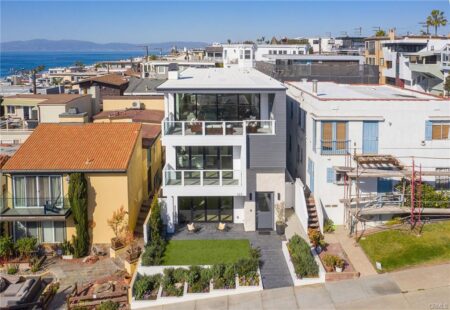 Manhattan Beach with an impressive 55 on market home sales. The average list price was $2,963,145 with the average “sold” price of $2,981,462. Homes averaged only 39 days on market before going into escrow and the average price per foot was an impressive $1,314. The top on market sale of the month (there was an off market sale slightly higher) was for a walkstreet home at 316 20th Street that sold for $7,000,000. Of the 55 homes that sold the breakdown was:

 the equivalent homes in North Redondo…..why? The primary reason is location as South Redondo extends all the way to the beach along the Esplanade, whereas homes in North Redondo are a car ride or longer walk/bike ride from the beach. Take a look below at the most recent real estate trends and statistics for only the 90277 zip in South Redondo Beach.