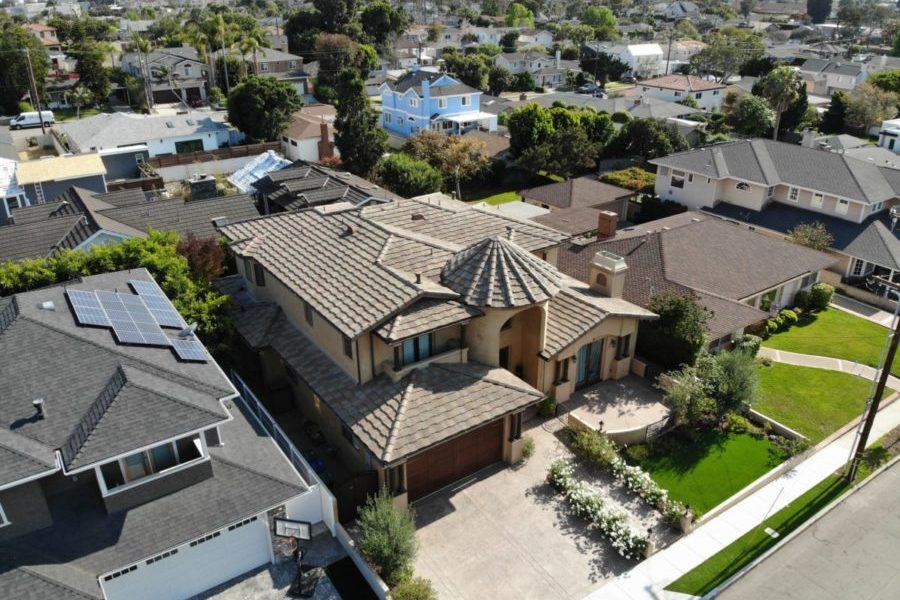
Welcome to everything real estate in the South Bay. We strive to be the most comprehensive real estate you’ll find. Unlike the national real  estate portals, we are top realtors in the South Bay and Beach Cities and have put together information you cannot find anywhere else. Get community information, search the current homes for sale, find the value of your home and more…
There is no sign ups or enrollments needed on our site and we hope that we can show you just how knowledgable and helpful we can be with all of your real estate needs and hope to earn your business.
Visit our links at the top of the page or visit our home search by community page to view all of the current homes for sale by specific city or neighborhood.
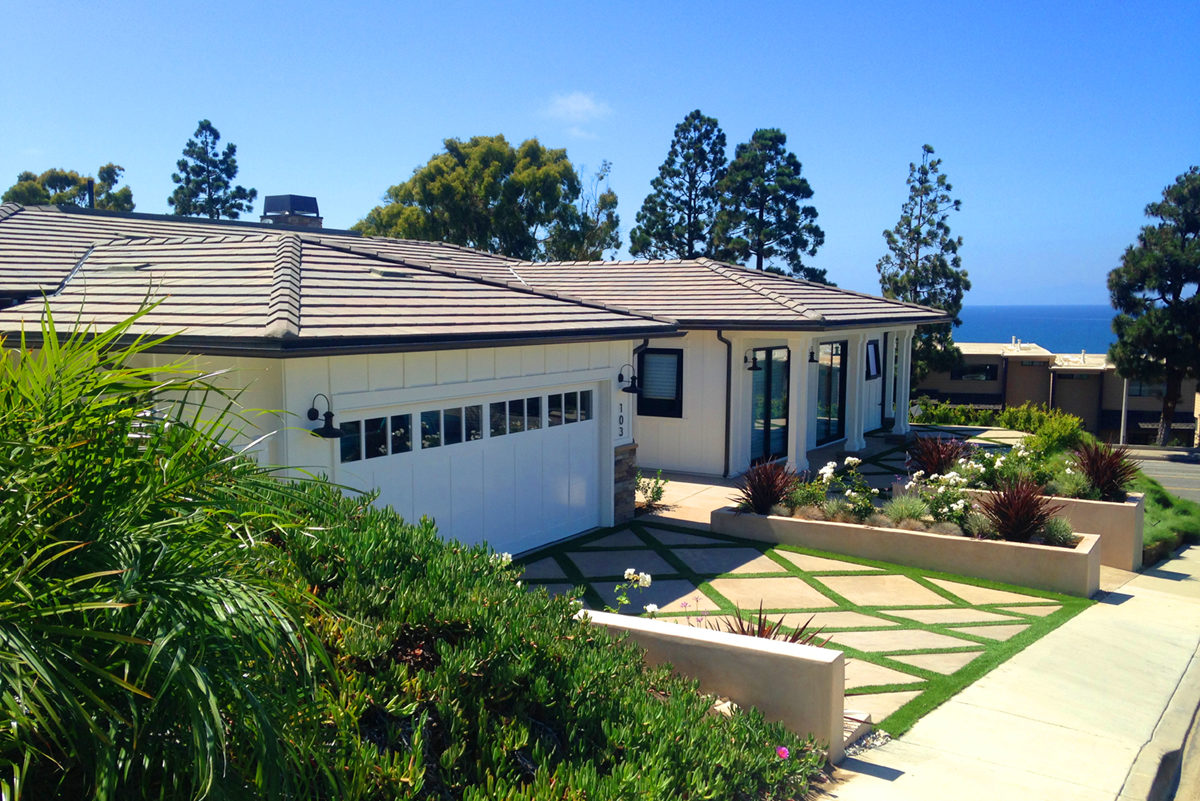
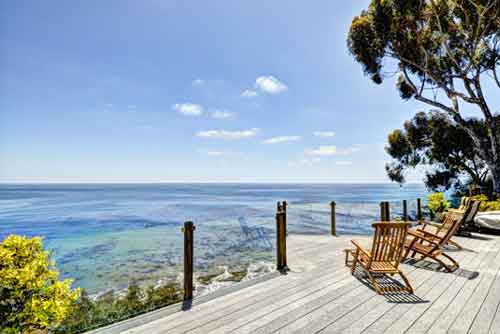
Welcome to the many wondeful cities and neighborhoods of the South Bay, beach cities and Palos Verdes. Click on any of the links below to learn more about the community and real estate. See the homes for sale and get to know what makes each neighborhood unique and different.
If you want other information or would like our assistance with your search please don’t hesitate to contact Keith Kyle for all of your real estate needs.
South Bay Communities and Homes for Sale
 |
 |
 |
 |
 |
 |
  |
 |
 |
 |
 |
 |
 |
 |
 |
 |
 |
 |
 |
 |
 |
 |
 |
 |
 |
 |
 |
 |
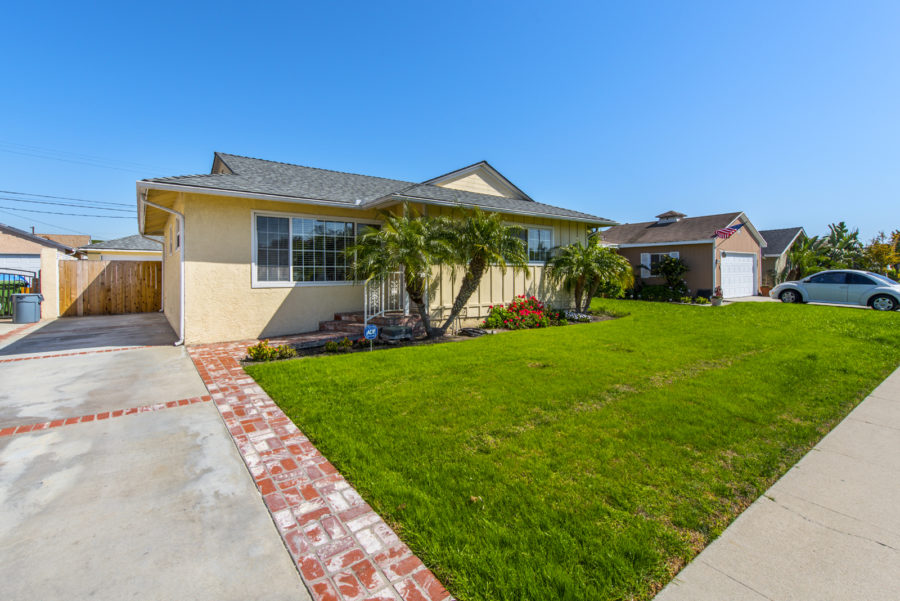
 the information below is helpful, whether you are considering buying a home in Redondo, or selling your property in North or South Redondo.